Projects
Some of the projects I like
Final Presentation
Detecting Microplastics Using Microwave Resonance
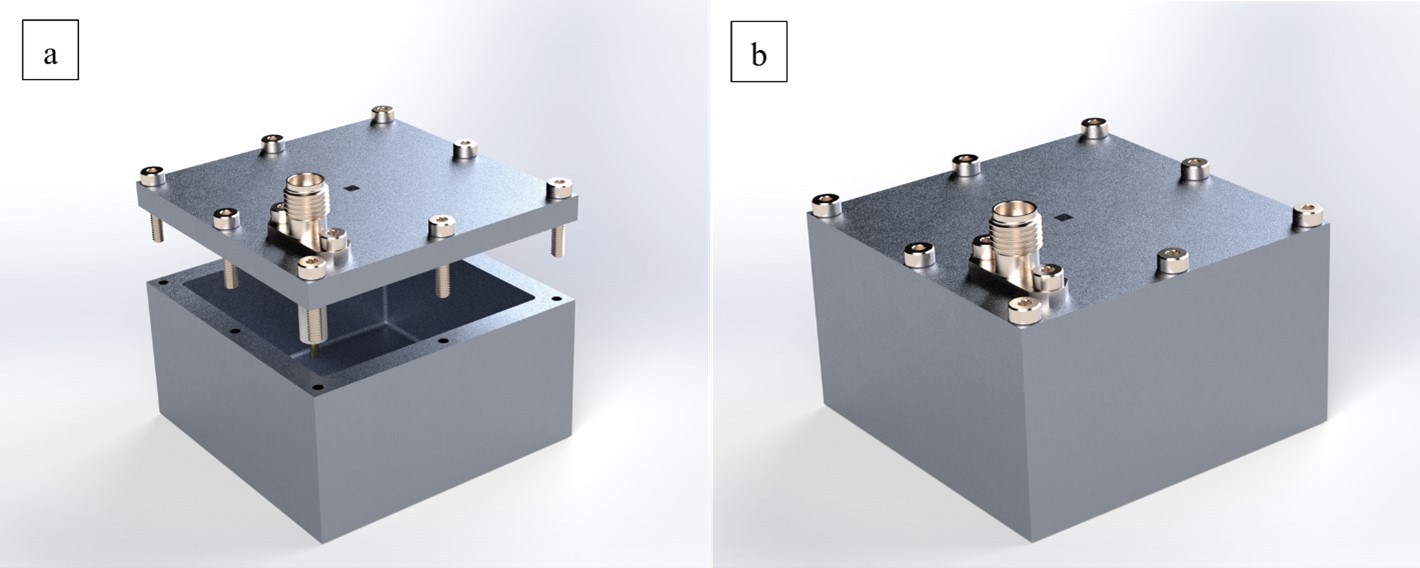
Microplastics are polymer-based fragments with a characteristic size below 5mm. The presence of microplastics has significant impacts on human health, aquatic life, and the quality of soil.
Microplastics has leaked to every part of our life. Every week, we ingest an average of five grams of plastic, the equivalent of the weight of a credit card. This is dangerous in the long term as studies have found that microplastics can cause damage to human cells, trigger allergic reactions, and lead to inflammatory bowel disease. As a result, the microplastics presence in drinking water and other processed foods has created alarming food safety concerns. In aquatic environments, microplastics have deleterious effects including but not limited to the reduction of predatory performance and neurofunction activities, dysfunction in reproduction, and even mortality. Its threat to the aquatic life consequently results in disturbance in the ecosystem. In agriculture where control is essential for plant growth, the presence of microplastics in the soil can affect soil water dynamics and soil aggregation. For example, microplastics can create channels for water movement and thus accelerate soil water evaporation, which is undesired for controlling and monitoring plant growth.
Unfortunately, despite the negative impact microplastics can bring to both the environment and people, microplastics are still found in abundance in the natural environment, including marine, wastewater, fresh water, and food. This is largely due to the consumption of plastic products, the rising food delivery culture, and use of laundry machines to wash clothes which makes plastic fibres to break apart easily. From a global study conducted in 2018, microplastics are already found in 93% of the bottled water brands in different countries. Due to the short life span of plastics products, only 29% of the manufactured plastics are recycled, and 71% are released into the environment as waste every year.
Motivation
Given the current circumstance, microplastic detection, quantification, and monitoring are the first step to improve the situation faced by the natural environment. By constantly monitoring the microplastic concentration of a system, pollution trends can be developed to analyze areas with an imminent threat. By identifying the type of microplastics, the source of microplastics can be tracked to target the problem and a possible solution is determined for a reduction in microplastic use of the source. Currently, there is no global standardization of sampling methods for counting microplastics in water. This is mainly because the current microplastic detection technologies have different strengths and are non-ideal: some methods provide higher accuracy than other methods, and all methods still all have long testing times (ranging from a few days to weeks depending on the sample size). Hence different groups may prefer different methods depending on their specific interest. Consequently, interlaboratory comparisons cannot be performed for more in-depth analysis and microplastic studies. Therefore, a rapid and accurate microplastic detection method is recommended to be developed and used as a standardized sampling method. Although it is ambitious to make a new method as a standardized method used in the industry, rapid testing is more efficient and preferred than slow testing as long as the accuracy of the test result is ensured. Having a robust microplastic detection system will speed up the analysis of microplastics in many sectors. Hence this is enough motivation for the design team to explore further the need for a new microplastic detection method.
System Level Design
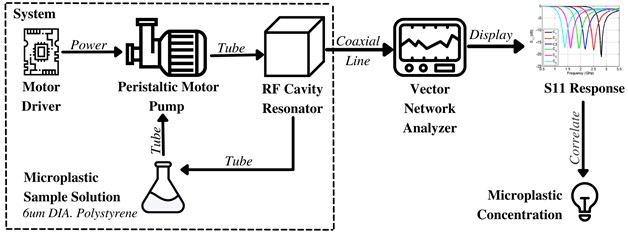
The system-level overview is depicted below. The design is composed of three main sections: the sample solution, the pump system, and the resonator. The vector network analyzer (VNA) lies outside the system box as it is a peripheral measurement tool.
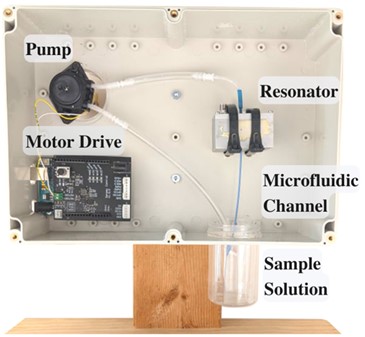
The project box is shown below:
Cavity Resonator Design
There are lots of good resources that can be found online for designing cavity resonators. I found this article to be particularly helpful: here. In summary the whole system can be characterized by the resonant frequency equation for the TE101 mode:
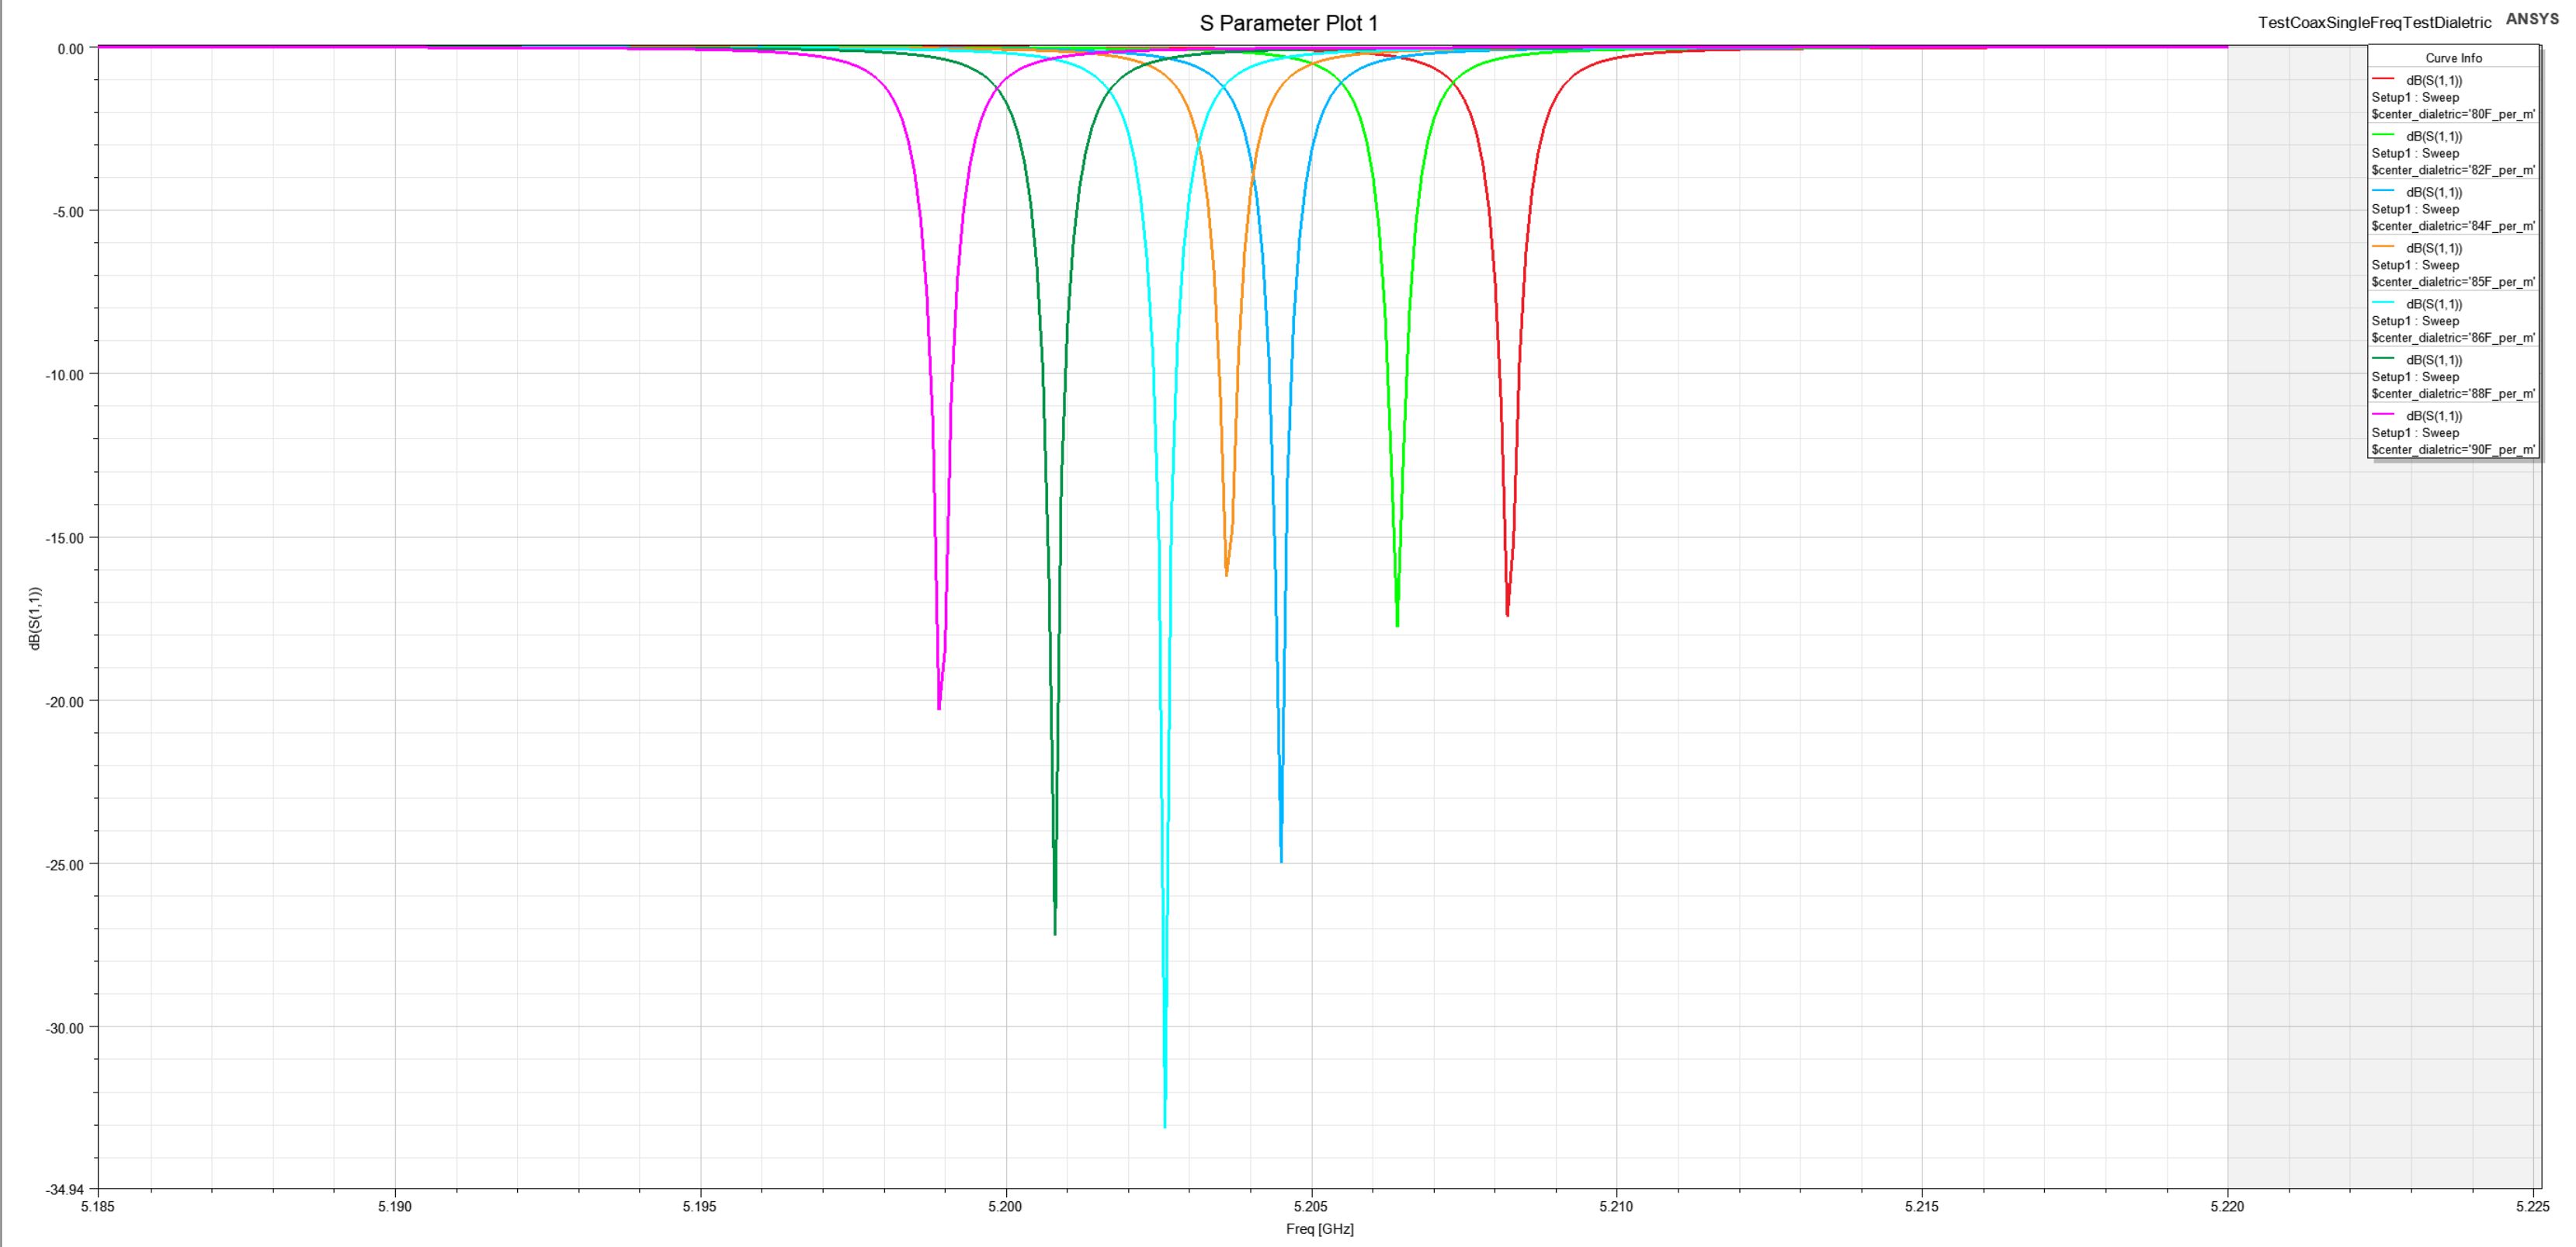
Based off of the properties within the cavity resonator the resonant frequency will change. Using the fact that water with microplastics has a different dialectric constant and loss tangent, the resonant frequency and magnitude should change.
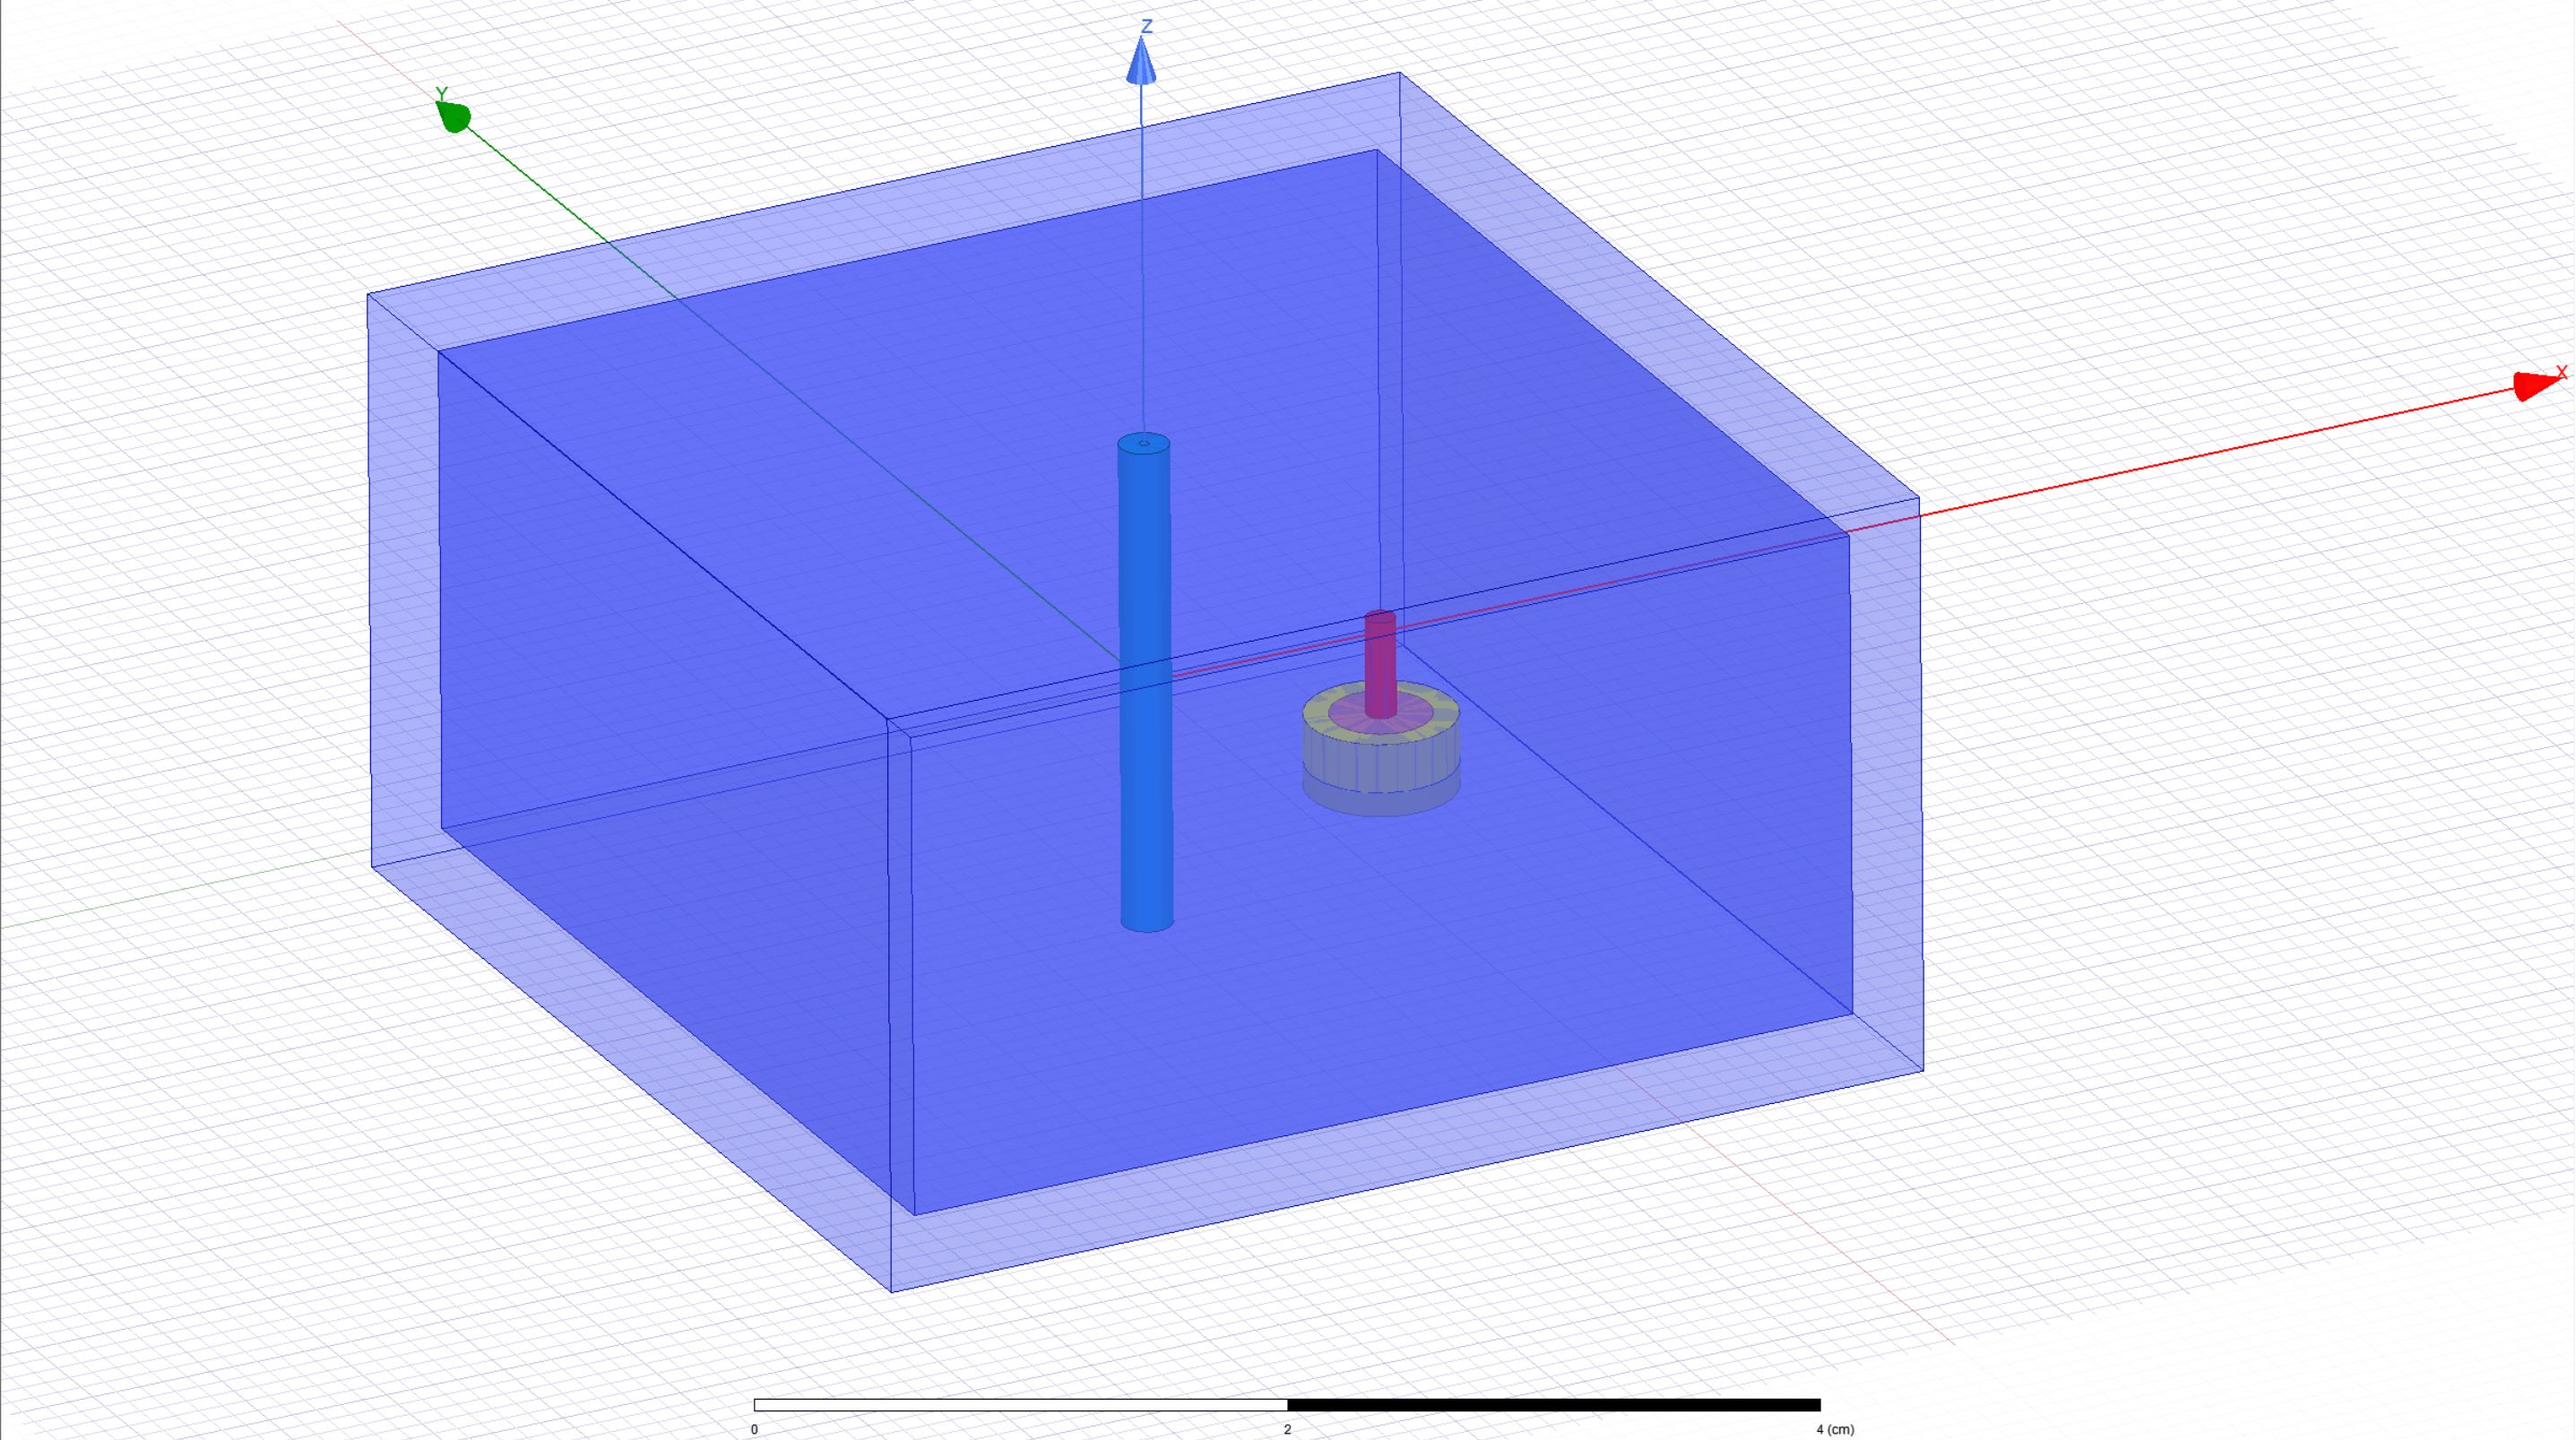
Ansys HFSS was used to design the resonator with the following model.
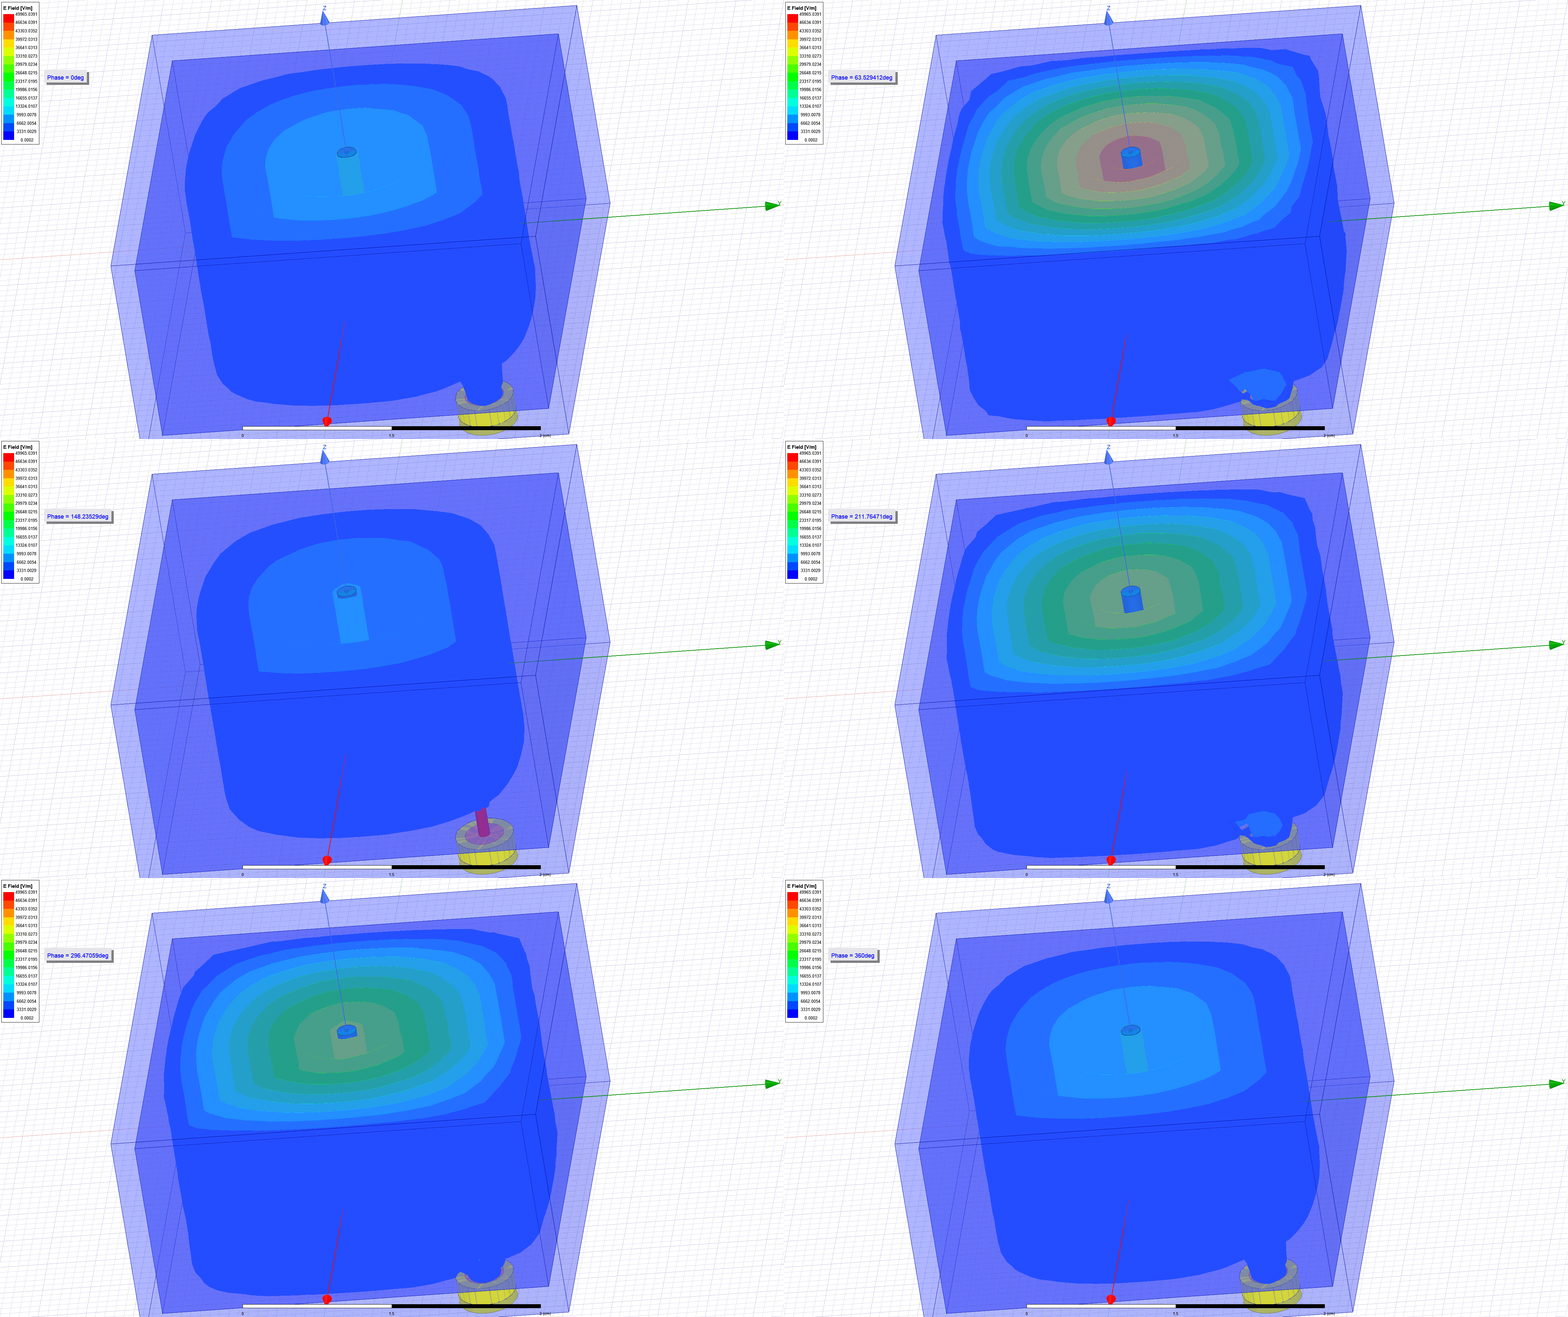
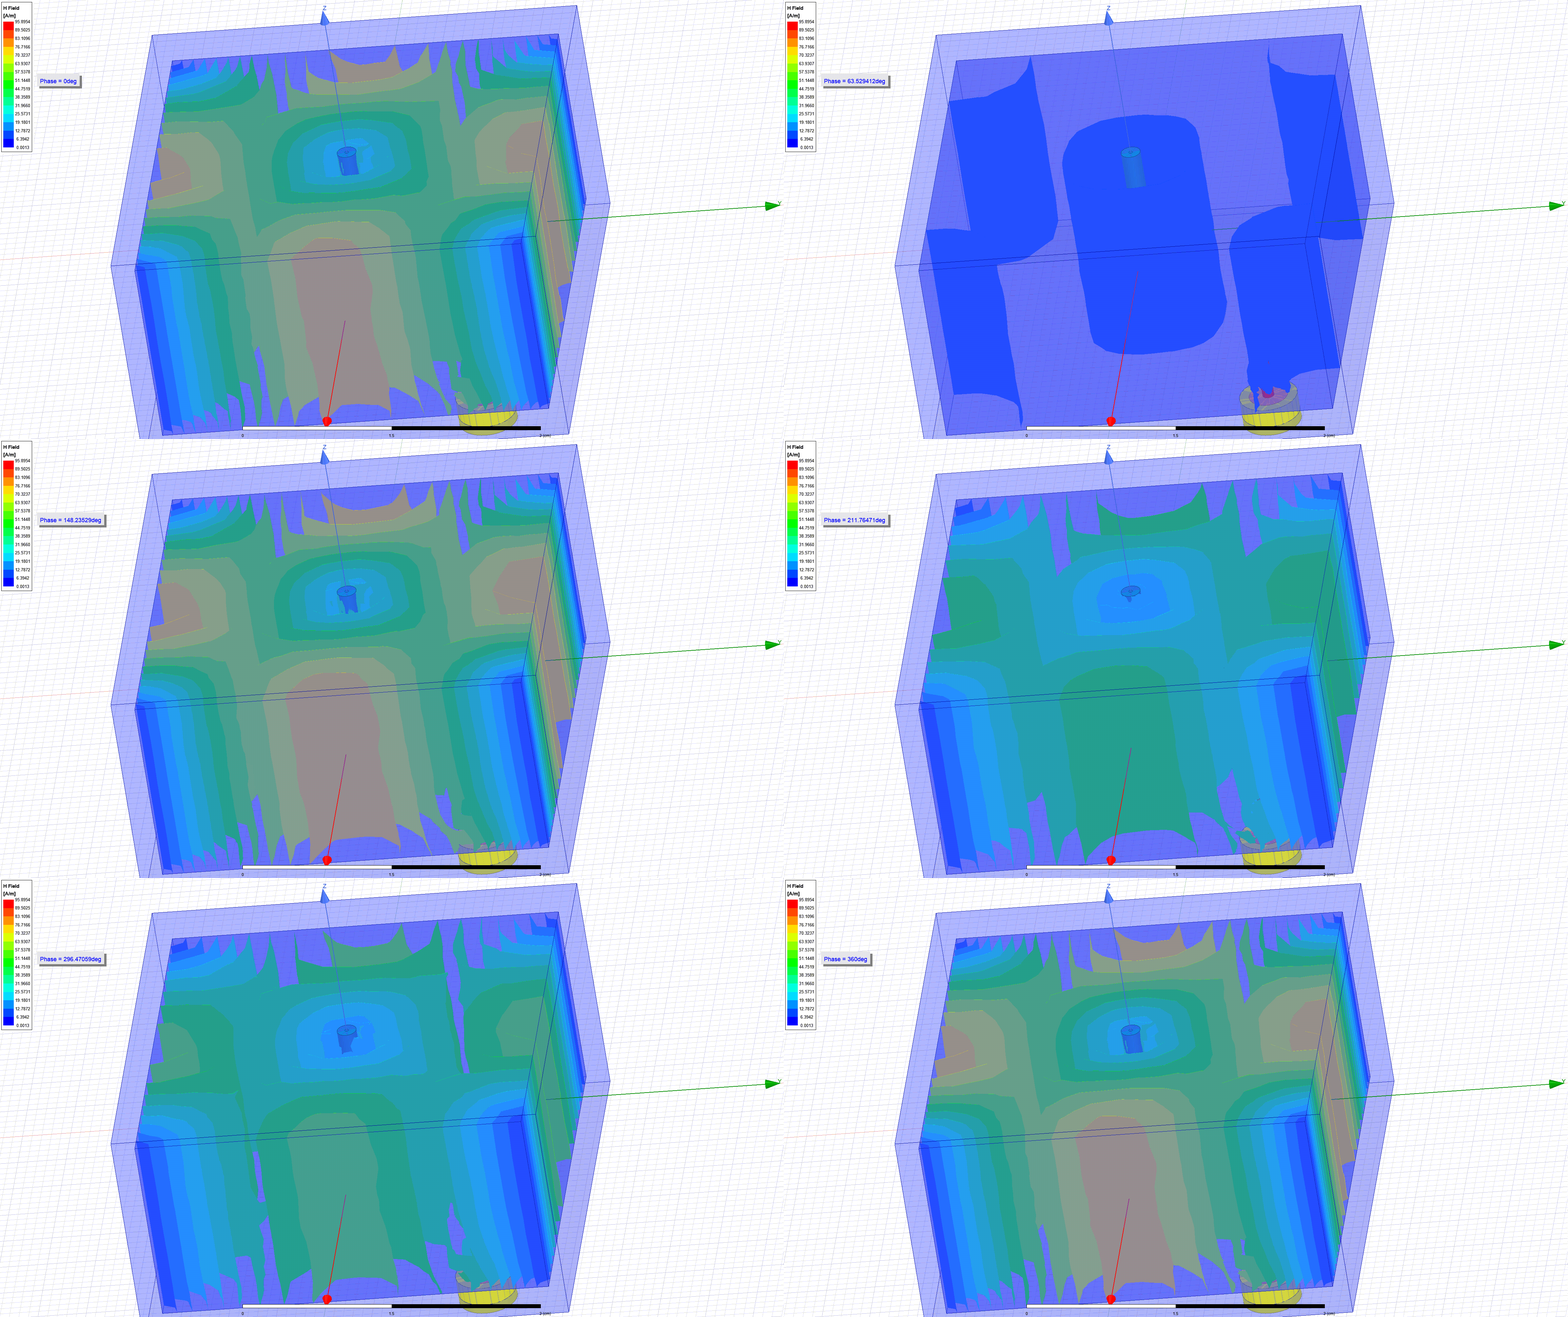
Here are some of the interesting results from the design.
E Field Concentration
H Field Concentration
This is also a change in resonant frequency due to a change in concentration of microplastics:
Testing
The test procedure is composed of 3 major steps: tuning, finding initial reference, and running trials.
- Tuning Cavity: the resonator was first tuned in the presence of distilled water in the fluidic channel. The length of the coax cable that is inserted into the chamber was gradually shortened by cutting and until the observed S11 response on the VNA display exhibits a sharp dip around the designed resonant frequency. Since the system is expected to resonate with presence of microplastic solution, it is important to ensure that the cavity resonator functions well with water. Hence, the resonator was initially tuned with distilled water.
- Finding Initial Reference: After the resonator was tuned, the system runs with presence of distilled water as the base case, and the VNA records the corresponding S11 response. This S11 response serves as a point of reference for comparison of future trials’ results. This is because the system currently has 0ppm microplastic concentration, and future trials are varying by increasing the microplastic concentration levels.
- Running Trials: After recording the base case (0ppm microplastic concentration), the system was run multiple times using solutions of different microplastic concentration levels. In between each trial, the system was run with distilled water for 2 minutes to clear any possible residues in the tubing to ensure the measurement accuracy.
Testing Results
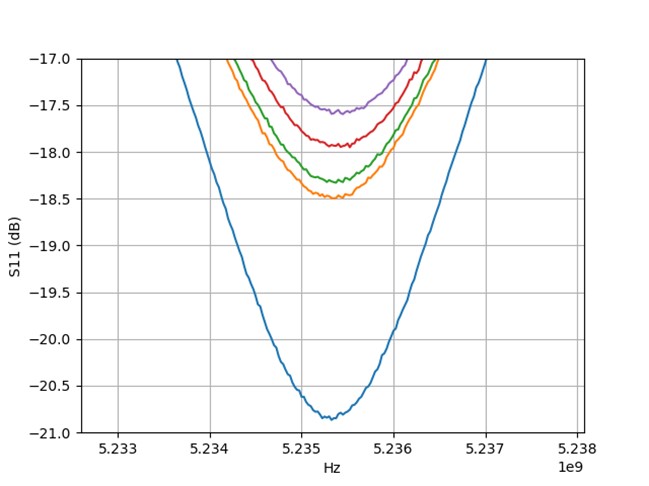
The S11 response to increasing microplastic concentration is depicted below, and concentration levels represented by different colors in the graph are clarified in the table below. It is observed that there is a consistent increase S11 magnitude with increasing microplastic concentration but insignificant change in the resonant frequency.
Concentration Resonant Frequency Magnitude Results
| Colour | PPM | Resonant Frequency (Hz) | Minimum Magnitude (dB) |
|---|---|---|---|
| Blue | 0ppm | 5235325000 | -20.86 |
| Orange | 300ppm | 5235350000 | -18.49 |
| Green | 500ppm | 5235375000 | -18.33 |
| Red | 700ppm | 5235525000 | -17.95 |
| Purple | 900ppm | 5235450000 | -17.59 |
Concentration Resonant Frequency Magnitude Calculated Results
| PPM | Q Factor | Loss Tangent |
|---|---|---|
| 0ppm | 1853.2 | 0.000540 |
| 300ppm | 1424.6 | 0.000702 |
| 500ppm | 1415.0 | 0.000707 |
| 700ppm | 1359.9 | 0.000735 |
| 900ppm | 1317.1 | 0.000759 |
From the test results, it was observed that there is a strong relationship between the resonant magnitude and the microplastic concentration level, and the resonant frequency change was insignificant. To understand this relationship, a relation to the Q factor and loss tangent much be made. Loss tangent measures the amount of energy lost vs energy stored in a material. This means, if more energy is lost in the material, there will be a higher loss tangent. It is also important to note that the loss tangent is inversely proportional to the Q factor. When Q factor is high, the loss tangent is low and vice versa.
The loss tangent trend is found to increase with concentration, this relationship is depicted in Table 4. This finding is consistent with the theoretical explanation of the system: with an increase in concentration, the material is more “lossy” and more of the RF energy is dissipated in the fluid and plastics, resulting in increasing loss tangent.
However, the observation of S11 magnitude increase with increasing concentration level is difficult to explain. Since S11 is the amount of energy reflected vs the energy incident into a device, a higher S11 (closer to 0dB) means more energy is reflected while a lower S11 (more negative in dB) means less energy is reflected. Theoretically, the material with increasing concentration has more energy lost in the material, hence an increase in loss tangent should indicate an increase in S11 magnitude. However, the observation shows that as the loss tangent increases due to concentration increase, the S11 magnitude decreases, which is opposite of the theoretical prediction. After consulting our academic advisor Professor Raafat Mansour, the current explanation to this phenomenon is that there are some secondary effects produced within the system that led to consistent S11 magnitude increase, which are currently unknown.
In summary, consistent S11 magnitude change is observed, which is promising for correlation with the microplastic concentration. The approximation model used in microplastic concentration are presented in the following section of “How to Use the Result”. However, this relationship observed is non-ideal and there are some unknown secondary effects contributing to the result, hence, the errors and limitations, as well as suggestions for future design adjustments will also be discussed following the “How to Use the Result” section.
Test Results With Alcohol
Alcohol shows very promising results allowing a very strong correlation to concentration to be made.
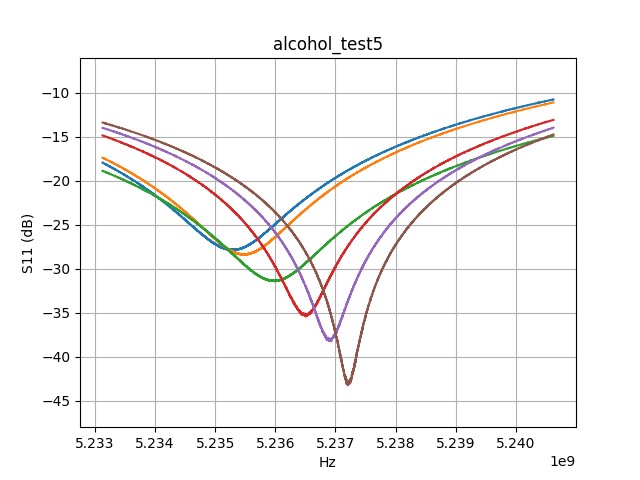
Alcohol Resonant Frequency Magnitude Results
| Test | Colour | Resonant Frequency (Hz) | Resonant Magnitude (dB) | Q Factor |
|---|---|---|---|---|
| Water | Blue | 5235268750 | -27.90 | 3673.9 |
| Alcohol1 | Orange | 5235492500 | -28.42 | 3892.6 |
| Alcohol2 | Green | 5235992500 | -31.42 | 5724.3 |
| Alcohol3 | Red | 5236507500 | -35.43 | 8709.4 |
| Alcohol4 | Purple | 5236928750 | -38.26 | 11936.1 |
| Alcohol5 | Brown | 5237212500 | -43.20 | 21267.9 |

